
Constellation Software Inc. (TSE:CSU) Shares Could Be 26% Below Their Intrinsic Value Estimate
Key Insights
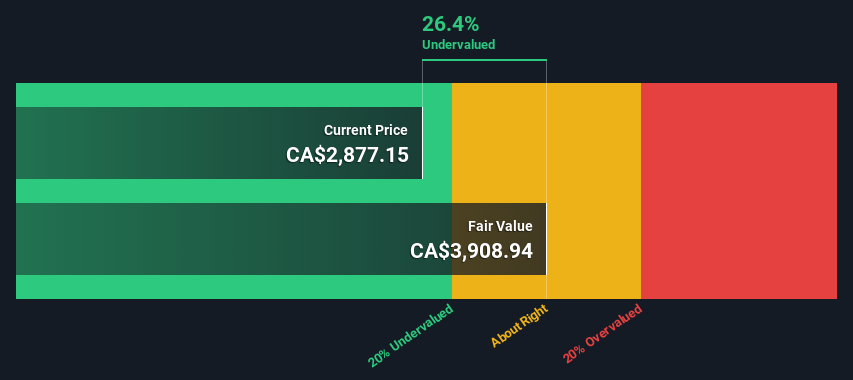
The projected fair value for Constellation Software is CA$3,909 based on 2 Stage Free Cash Flow to Equity
Constellation Software's CA$2,877 share price signals that it might be 26% undervalued
Analyst price target for CSU is US$3,169 which is 19% below our fair value estimate
Does the October share price for Constellation Software Inc. (TSE:CSU) reflect what it's really worth? Today, we will estimate the stock's intrinsic value by taking the expected future cash flows and discounting them to their present value. Our analysis will employ the Discounted Cash Flow (DCF) model. Before you think you won't be able to understand it, just read on! It's actually much less complex than you'd imagine.
We would caution that there are many ways of valuing a company and, like the DCF, each technique has advantages and disadvantages in certain scenarios. For those who are keen learners of equity analysis, the Simply Wall St analysis model here may be something of interest to you.
View our latest analysis for Constellation Software
The Model
We're using the 2-stage growth model, which simply means we take in account two stages of company's growth. In the initial period the company may have a higher growth rate and the second stage is usually assumed to have a stable growth rate. To start off with, we need to estimate the next ten years of cash flows. Where possible we use analyst estimates, but when these aren't available we extrapolate the previous free cash flow (FCF) from the last estimate or reported value. We assume companies with shrinking free cash flow will slow their rate of shrinkage, and that companies with growing free cash flow will see their growth rate slow, over this period. We do this to reflect that growth tends to slow more in the early years than it does in later years.
Generally we assume that a dollar today is more valuable than a dollar in the future, and so the sum of these future cash flows is then discounted to today's value:
10-year free cash flow (FCF) estimate
2024 | 2025 | 2026 | 2027 | 2028 | 2029 | 2030 | 2031 | 2032 | 2033 | |
Levered FCF ($, Millions) | US$2.08b | US$2.43b | US$2.72b | US$2.97b | US$3.17b | US$3.34b | US$3.49b | US$3.61b | US$3.73b | US$3.83b |
Growth Rate Estimate Source | Analyst x4 | Est @ 16.56% | Est @ 12.15% | Est @ 9.06% | Est @ 6.90% | Est @ 5.39% | Est @ 4.33% | Est @ 3.59% | Est @ 3.07% | Est @ 2.71% |
Present Value ($, Millions) Discounted @ 6.9% | US$1.9k | US$2.1k | US$2.2k | US$2.3k | US$2.3k | US$2.2k | US$2.2k | US$2.1k | US$2.0k | US$2.0k |
("Est" = FCF growth rate estimated by Simply Wall St)
Present Value of 10-year Cash Flow (PVCF) = US$21b
The second stage is also known as Terminal Value, this is the business's cash flow after the first stage. The Gordon Growth formula is used to calculate Terminal Value at a future annual growth rate equal to the 5-year average of the 10-year government bond yield of 1.9%. We discount the terminal cash flows to today's value at a cost of equity of 6.9%.
Terminal Value (TV)= FCF2033 × (1 + g) ÷ (r – g) = US$3.8b× (1 + 1.9%) ÷ (6.9%– 1.9%) = US$77b
Present Value of Terminal Value (PVTV)= TV / (1 + r)10= US$77b÷ ( 1 + 6.9%)10= US$40b
The total value is the sum of cash flows for the next ten years plus the discounted terminal value, which results in the Total Equity Value, which in this case is US$61b. To get the intrinsic value per share, we divide this by the total number of shares outstanding. Compared to the current share price of CA$2.9k, the company appears a touch undervalued at a 26% discount to where the stock price trades currently. The assumptions in any calculation have a big impact on the valuation, so it is better to view this as a rough estimate, not precise down to the last cent.
The Assumptions
We would point out that the most important inputs to a discounted cash flow are the discount rate and of course the actual cash flows. You don't have to agree with these inputs, I recommend redoing the calculations yourself and playing with them. The DCF also does not consider the possible cyclicality of an industry, or a company's future capital requirements, so it does not give a full picture of a company's potential performance. Given that we are looking at Constellation Software as potential shareholders, the cost of equity is used as the discount rate, rather than the cost of capital (or weighted average cost of capital, WACC) which accounts for debt. In this calculation we've used 6.9%, which is based on a levered beta of 1.009. Beta is a measure of a stock's volatility, compared to the market as a whole. We get our beta from the industry average beta of globally comparable companies, with an imposed limit between 0.8 and 2.0, which is a reasonable range for a stable business.
SWOT Analysis for Constellation Software
Strength
Debt is well covered by earnings and cashflows.
Weakness
Earnings growth over the past year underperformed the Software industry.
Dividend is low compared to the top 25% of dividend payers in the Software market.
Opportunity
Annual earnings are forecast to grow faster than the Canadian market.
Trading below our estimate of fair value by more than 20%.
Threat
Revenue is forecast to grow slower than 20% per year.
Next Steps:
Valuation is only one side of the coin in terms of building your investment thesis, and it shouldn't be the only metric you look at when researching a company. It's not possible to obtain a foolproof valuation with a DCF model. Preferably you'd apply different cases and assumptions and see how they would impact the company's valuation. For example, changes in the company's cost of equity or the risk free rate can significantly impact the valuation. What is the reason for the share price sitting below the intrinsic value? For Constellation Software, we've compiled three further aspects you should further research:
Risks: Every company has them, and we've spotted 1 warning sign for Constellation Software you should know about.
Future Earnings: How does CSU's growth rate compare to its peers and the wider market? Dig deeper into the analyst consensus number for the upcoming years by interacting with our free analyst growth expectation chart.
Other High Quality Alternatives: Do you like a good all-rounder? Explore our interactive list of high quality stocks to get an idea of what else is out there you may be missing!
PS. Simply Wall St updates its DCF calculation for every Canadian stock every day, so if you want to find the intrinsic value of any other stock just search here.
Have feedback on this article? Concerned about the content? Get in touch with us directly. Alternatively, email editorial-team (at) simplywallst.com.
This article by Simply Wall St is general in nature. We provide commentary based on historical data and analyst forecasts only using an unbiased methodology and our articles are not intended to be financial advice. It does not constitute a recommendation to buy or sell any stock, and does not take account of your objectives, or your financial situation. We aim to bring you long-term focused analysis driven by fundamental data. Note that our analysis may not factor in the latest price-sensitive company announcements or qualitative material. Simply Wall St has no position in any stocks mentioned.

