
Is Mueller Industries, Inc.’s (NYSE:MLI) 14% ROCE Any Good?

Today we are going to look at Mueller Industries, Inc. (NYSE:MLI) to see whether it might be an attractive investment prospect. In particular, we'll consider its Return On Capital Employed (ROCE), as that can give us insight into how profitably the company is able to employ capital in its business.
First up, we'll look at what ROCE is and how we calculate it. Then we'll compare its ROCE to similar companies. Last but not least, we'll look at what impact its current liabilities have on its ROCE.
What is Return On Capital Employed (ROCE)?
ROCE is a measure of a company's yearly pre-tax profit (its return), relative to the capital employed in the business. Generally speaking a higher ROCE is better. Ultimately, it is a useful but imperfect metric. Author Edwin Whiting says to be careful when comparing the ROCE of different businesses, since 'No two businesses are exactly alike.'
So, How Do We Calculate ROCE?
The formula for calculating the return on capital employed is:
Return on Capital Employed = Earnings Before Interest and Tax (EBIT) ÷ (Total Assets - Current Liabilities)
Or for Mueller Industries:
0.14 = US$172m ÷ (US$1.4b - US$227m) (Based on the trailing twelve months to June 2019.)
So, Mueller Industries has an ROCE of 14%.
See our latest analysis for Mueller Industries
Does Mueller Industries Have A Good ROCE?
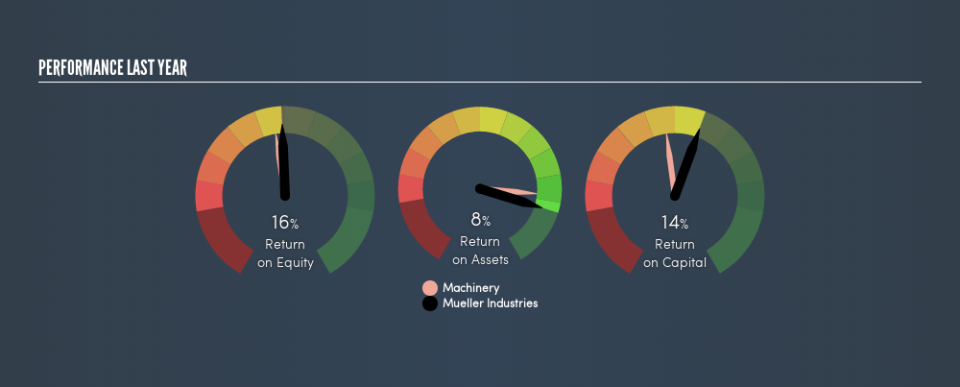
ROCE is commonly used for comparing the performance of similar businesses. In our analysis, Mueller Industries's ROCE is meaningfully higher than the 11% average in the Machinery industry. I think that's good to see, since it implies the company is better than other companies at making the most of its capital. Separate from Mueller Industries's performance relative to its industry, its ROCE in absolute terms looks satisfactory, and it may be worth researching in more depth.
We can see that , Mueller Industries currently has an ROCE of 14% compared to its ROCE 3 years ago, which was 11%. This makes us think the business might be improving. You can see in the image below how Mueller Industries's ROCE compares to its industry. Click to see more on past growth.
Remember that this metric is backwards looking - it shows what has happened in the past, and does not accurately predict the future. Companies in cyclical industries can be difficult to understand using ROCE, as returns typically look high during boom times, and low during busts. This is because ROCE only looks at one year, instead of considering returns across a whole cycle. If Mueller Industries is cyclical, it could make sense to check out this free graph of past earnings, revenue and cash flow.
Do Mueller Industries's Current Liabilities Skew Its ROCE?
Short term (or current) liabilities, are things like supplier invoices, overdrafts, or tax bills that need to be paid within 12 months. Due to the way the ROCE equation works, having large bills due in the near term can make it look as though a company has less capital employed, and thus a higher ROCE than usual. To check the impact of this, we calculate if a company has high current liabilities relative to its total assets.
Mueller Industries has total liabilities of US$227m and total assets of US$1.4b. Therefore its current liabilities are equivalent to approximately 16% of its total assets. Current liabilities are minimal, limiting the impact on ROCE.
The Bottom Line On Mueller Industries's ROCE
With that in mind, Mueller Industries's ROCE appears pretty good. Mueller Industries shapes up well under this analysis, but it is far from the only business delivering excellent numbers . You might also want to check this free collection of companies delivering excellent earnings growth.
I will like Mueller Industries better if I see some big insider buys. While we wait, check out this free list of growing companies with considerable, recent, insider buying.
We aim to bring you long-term focused research analysis driven by fundamental data. Note that our analysis may not factor in the latest price-sensitive company announcements or qualitative material.
If you spot an error that warrants correction, please contact the editor at editorial-team@simplywallst.com. This article by Simply Wall St is general in nature. It does not constitute a recommendation to buy or sell any stock, and does not take account of your objectives, or your financial situation. Simply Wall St has no position in the stocks mentioned. Thank you for reading.

