
Can Flushing Financial Corporation (NASDAQ:FFIC) Survive The Next Financial Crisis?

Flushing Financial Corporation’s (NASDAQ:FFIC) profitability and risk are largely affected by the underlying economic growth for the region it operates in US given it is a small-cap stock with a market capitalisation of US$699.3m. Given that banks operate by reinvesting deposits in the form of loans, negative economic growth may lower the level of saving deposits and demand for loans, directly affecting those banks’ levels of cash flows. Post-GFC recovery brought about a new set of reforms, Basel III, which was created to improve regulation, supervision and risk management in the financial services industry. These reforms target bank level regulation and aims to improve the banking sector’s ability to absorb shocks arising from economic stress which could expose financial institutions to vulnerabilities. Since its financial standing can unexpectedly decline in the case of an adverse macro event such as political instability, it is important to understand how prudent the bank is at managing its risk levels. Sufficient liquidity and low levels of leverage could place the bank in a safe place in case of unexpected macro headwinds. Today we will be measuring Flushing Financial’s financial risk position by looking at three leverage and liquidity metrics.
View our latest analysis for Flushing Financial
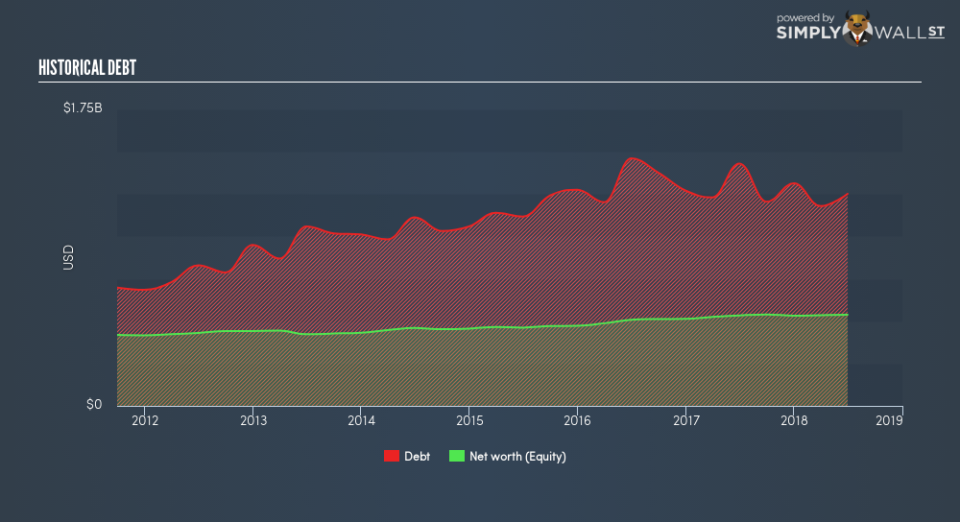
Is FFIC’s Leverage Level Appropriate?
A low level of leverage subjects a bank to less risk and enhances its ability to pay back its debtors. Leverage can be thought of as the amount of assets a bank owns relative to its shareholders’ funds. Though banks are required to have a certain level of buffer to meet its capital requirements, Flushing Financial’s leverage level of 12.02x is significantly below the appropriate ceiling of 20x. This means the bank has a sensibly high level of equity compared to the level of debt it has taken on to maintain operations which places it in a strong position to pay back its debt in unforeseen circumstances. If the bank needs to firm up its capital cushion, it has ample headroom to increase its debt level without deteriorating its financial position.
How Should We Measure FFIC’s Liquidity?

Due to its illiquid nature, loans are an important asset class we should learn more about. Usually, they should not be higher than 70% of total assets, but its current level of 82.2% means the bank has obviously lent out 12.16% above the sensible upper limit. This indicates that revenue is dependent on this particular asset but also the bank is more likely to be exposed to default compared to its competitors with less loans.
Does FFIC Have Liquidity Mismatch?
Banks profit by lending out its customers’ deposits as loans and charge an interest on the principle. These loans may be fixed term and often cannot be readily realized, yet customer deposits on the liability side must be paid on-demand and in short notice. The discrepancy between loan assets and deposit liabilities threatens the bank’s financial position. If an adverse event occurs, it may not be well-placed to repay its depositors immediately. Compared to the appropriate industry loan to deposit level of 90%, Flushing Financial’s ratio of over 117% is higher, which places the bank in a relatively dangerous position given the negative liquidity discrepancy. Essentially, for $1 of deposits with the bank, it lends out more than $1 which is unsustainable.
Next Steps:
Keep in mind that a stock investment requires research on more than just its operational side. Below, I’ve compiled three relevant factors you should look at:
Future Outlook: What are well-informed industry analysts predicting for FFIC’s future growth? Take a look at our free research report of analyst consensus for FFIC’s outlook.
Valuation: What is FFIC worth today? Has the future growth potential already been factored into the price? The intrinsic value infographic in our free research report helps visualize whether FFIC is currently mispriced by the market.
Other High-Performing Stocks: Are there other stocks that provide better prospects with proven track records? Explore our free list of these great stocks here.
To help readers see past the short term volatility of the financial market, we aim to bring you a long-term focused research analysis purely driven by fundamental data. Note that our analysis does not factor in the latest price-sensitive company announcements.
The author is an independent contributor and at the time of publication had no position in the stocks mentioned. For errors that warrant correction please contact the editor at editorial-team@simplywallst.com.

