
ANSYS (NASDAQ:ANSS) Has A Rock Solid Balance Sheet
Legendary fund manager Li Lu (who Charlie Munger backed) once said, 'The biggest investment risk is not the volatility of prices, but whether you will suffer a permanent loss of capital.' So it might be obvious that you need to consider debt, when you think about how risky any given stock is, because too much debt can sink a company. We note that ANSYS, Inc. (NASDAQ:ANSS) does have debt on its balance sheet. But is this debt a concern to shareholders?
When Is Debt A Problem?
Debt assists a business until the business has trouble paying it off, either with new capital or with free cash flow. Ultimately, if the company can't fulfill its legal obligations to repay debt, shareholders could walk away with nothing. While that is not too common, we often do see indebted companies permanently diluting shareholders because lenders force them to raise capital at a distressed price. Having said that, the most common situation is where a company manages its debt reasonably well - and to its own advantage. The first step when considering a company's debt levels is to consider its cash and debt together.
See our latest analysis for ANSYS
What Is ANSYS's Debt?
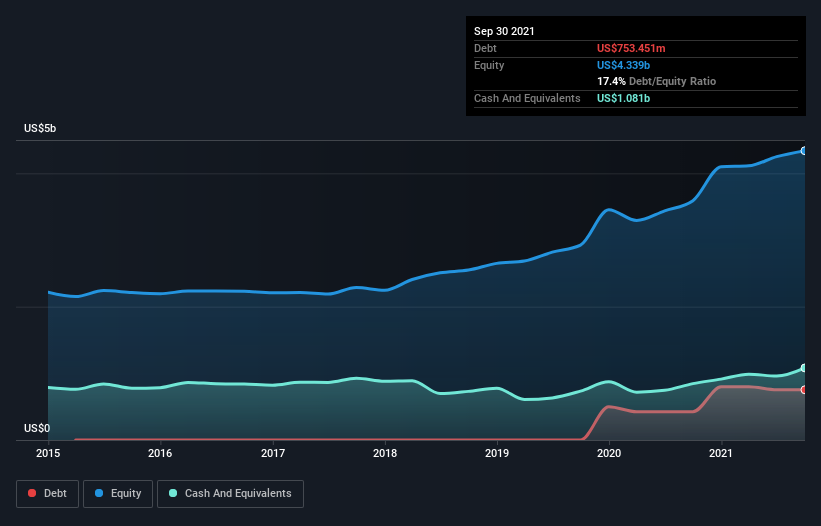
You can click the graphic below for the historical numbers, but it shows that as of September 2021 ANSYS had US$753.5m of debt, an increase on US$423.8m, over one year. However, its balance sheet shows it holds US$1.08b in cash, so it actually has US$327.9m net cash.
How Strong Is ANSYS' Balance Sheet?
Zooming in on the latest balance sheet data, we can see that ANSYS had liabilities of US$600.4m due within 12 months and liabilities of US$1.04b due beyond that. On the other hand, it had cash of US$1.08b and US$624.8m worth of receivables due within a year. So it actually has US$70.7m more liquid assets than total liabilities.
This state of affairs indicates that ANSYS' balance sheet looks quite solid, as its total liabilities are just about equal to its liquid assets. So it's very unlikely that the US$34.4b company is short on cash, but still worth keeping an eye on the balance sheet. Simply put, the fact that ANSYS has more cash than debt is arguably a good indication that it can manage its debt safely.
Also positive, ANSYS grew its EBIT by 27% in the last year, and that should make it easier to pay down debt, going forward. The balance sheet is clearly the area to focus on when you are analysing debt. But ultimately the future profitability of the business will decide if ANSYS can strengthen its balance sheet over time. So if you're focused on the future you can check out this free report showing analyst profit forecasts.
Finally, a company can only pay off debt with cold hard cash, not accounting profits. ANSYS may have net cash on the balance sheet, but it is still interesting to look at how well the business converts its earnings before interest and tax (EBIT) to free cash flow, because that will influence both its need for, and its capacity to manage debt. Happily for any shareholders, ANSYS actually produced more free cash flow than EBIT over the last three years. That sort of strong cash conversion gets us as excited as the crowd when the beat drops at a Daft Punk concert.
Summing up
While we empathize with investors who find debt concerning, you should keep in mind that ANSYS has net cash of US$327.9m, as well as more liquid assets than liabilities. The cherry on top was that in converted 102% of that EBIT to free cash flow, bringing in US$592m. So is ANSYS's debt a risk? It doesn't seem so to us. Above most other metrics, we think its important to track how fast earnings per share is growing, if at all. If you've also come to that realization, you're in luck, because today you can view this interactive graph of ANSYS's earnings per share history for free.
Of course, if you're the type of investor who prefers buying stocks without the burden of debt, then don't hesitate to discover our exclusive list of net cash growth stocks, today.
Have feedback on this article? Concerned about the content? Get in touch with us directly. Alternatively, email editorial-team (at) simplywallst.com.
This article by Simply Wall St is general in nature. We provide commentary based on historical data and analyst forecasts only using an unbiased methodology and our articles are not intended to be financial advice. It does not constitute a recommendation to buy or sell any stock, and does not take account of your objectives, or your financial situation. We aim to bring you long-term focused analysis driven by fundamental data. Note that our analysis may not factor in the latest price-sensitive company announcements or qualitative material. Simply Wall St has no position in any stocks mentioned.

