
ICS Global Limited (ASX:ICS) Stock Has Shown Weakness Lately But Financials Look Strong: Should Prospective Shareholders Make The Leap?

It is hard to get excited after looking at ICS Global's (ASX:ICS) recent performance, when its stock has declined 11% over the past week. But if you pay close attention, you might gather that its strong financials could mean that the stock could potentially see an increase in value in the long-term, given how markets usually reward companies with good financial health. In this article, we decided to focus on ICS Global's ROE.
Return on equity or ROE is a key measure used to assess how efficiently a company's management is utilizing the company's capital. In short, ROE shows the profit each dollar generates with respect to its shareholder investments.
Check out our latest analysis for ICS Global
How Is ROE Calculated?
Return on equity can be calculated by using the formula:
Return on Equity = Net Profit (from continuing operations) ÷ Shareholders' Equity
So, based on the above formula, the ROE for ICS Global is:
20% = AU$1.2m ÷ AU$6.3m (Based on the trailing twelve months to June 2020).
The 'return' is the income the business earned over the last year. So, this means that for every A$1 of its shareholder's investments, the company generates a profit of A$0.20.
Why Is ROE Important For Earnings Growth?
We have already established that ROE serves as an efficient profit-generating gauge for a company's future earnings. Based on how much of its profits the company chooses to reinvest or "retain", we are then able to evaluate a company's future ability to generate profits. Generally speaking, other things being equal, firms with a high return on equity and profit retention, have a higher growth rate than firms that don’t share these attributes.
A Side By Side comparison of ICS Global's Earnings Growth And 20% ROE
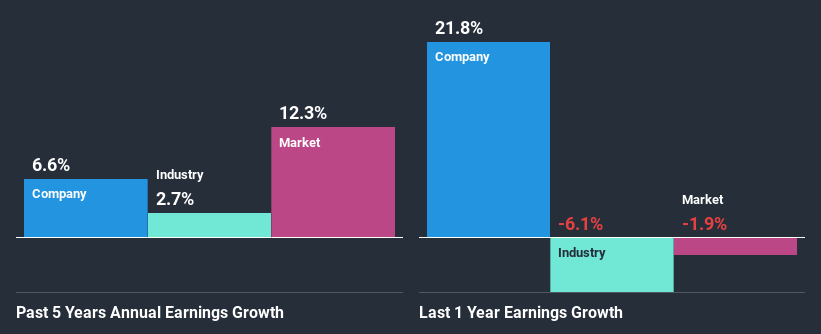
To start with, ICS Global's ROE looks acceptable. Especially when compared to the industry average of 8.9% the company's ROE looks pretty impressive. This certainly adds some context to ICS Global's decent 6.6% net income growth seen over the past five years.
We then compared ICS Global's net income growth with the industry and we're pleased to see that the company's growth figure is higher when compared with the industry which has a growth rate of 2.7% in the same period.
Earnings growth is an important metric to consider when valuing a stock. It’s important for an investor to know whether the market has priced in the company's expected earnings growth (or decline). By doing so, they will have an idea if the stock is headed into clear blue waters or if swampy waters await. If you're wondering about ICS Global's's valuation, check out this gauge of its price-to-earnings ratio, as compared to its industry.
Is ICS Global Efficiently Re-investing Its Profits?
The high three-year median payout ratio of 80% (or a retention ratio of 20%) for ICS Global suggests that the company's growth wasn't really hampered despite it returning most of its income to its shareholders.
Besides, ICS Global has been paying dividends over a period of eight years. This shows that the company is committed to sharing profits with its shareholders.
Conclusion
Overall, we are quite pleased with ICS Global's performance. In particular, its high ROE is quite noteworthy and also the probable explanation behind its considerable earnings growth. Yet, the company is retaining a small portion of its profits. Which means that the company has been able to grow its earnings in spite of it, so that's not too bad. Until now, we have only just grazed the surface of the company's past performance by looking at the company's fundamentals. To gain further insights into ICS Global's past profit growth, check out this visualization of past earnings, revenue and cash flows.
This article by Simply Wall St is general in nature. It does not constitute a recommendation to buy or sell any stock, and does not take account of your objectives, or your financial situation. We aim to bring you long-term focused analysis driven by fundamental data. Note that our analysis may not factor in the latest price-sensitive company announcements or qualitative material. Simply Wall St has no position in any stocks mentioned.
Have feedback on this article? Concerned about the content? Get in touch with us directly. Alternatively, email editorial-team@simplywallst.com.

