
Calculating The Intrinsic Value Of General Motors Company (NYSE:GM)

I am going to run you through how I calculated the intrinsic value of General Motors Company (NYSE:GM) by taking the expected future cash flows and discounting them to their present value. I will be using the Discounted Cash Flows (DCF) model. It may sound complicated, but actually it is quite simple! Anyone interested in learning a bit more about intrinsic value should have a read of the Simply Wall St analysis model. Please also note that this article was written in June 2018 so be sure check out the updated calculation by following the link below. View out our latest analysis for General Motors
The calculation
I’m using the 2-stage growth model, which simply means we take in account two stages of company’s growth. In the initial period the company may have a higher growth rate and the second stage is usually assumed to have perpetual stable growth rate. To start off with we need to estimate the next five years of cash flows. For this I used the consensus of the analysts covering the stock, as you can see below. I then discount the sum of these cash flows to arrive at a present value estimate.
5-year cash flow forecast
2018 | 2019 | 2020 | 2021 | 2022 | |
Levered FCF ($, Millions) | $4.84k | $4.69k | $4.81k | $7.98k | $7.85k |
Source | Analyst x8 | Analyst x7 | Analyst x2 | Analyst x1 | Analyst x1 |
Present Value Discounted @ 13.71% | $4.25k | $3.63k | $3.27k | $4.77k | $4.13k |
Present Value of 5-year Cash Flow (PVCF)= US$20.05b
We now need to calculate the Terminal Value, which accounts for all the future cash flows after the five years. For a number of reasons a very conservative growth rate is used that cannot exceed that of the GDP. In this case I have used the 10-year government bond rate (2.9%). In the same way as with the 5-year ‘growth’ period, we discount this to today’s value at a cost of equity of 13.7%.
Terminal Value (TV) = FCF2022 × (1 + g) ÷ (r – g) = US$7.85b × (1 + 2.9%) ÷ (13.7% – 2.9%) = US$75.05b
Present Value of Terminal Value (PVTV) = TV / (1 + r)5 = US$75.05b ÷ ( 1 + 13.7%)5 = US$39.47b
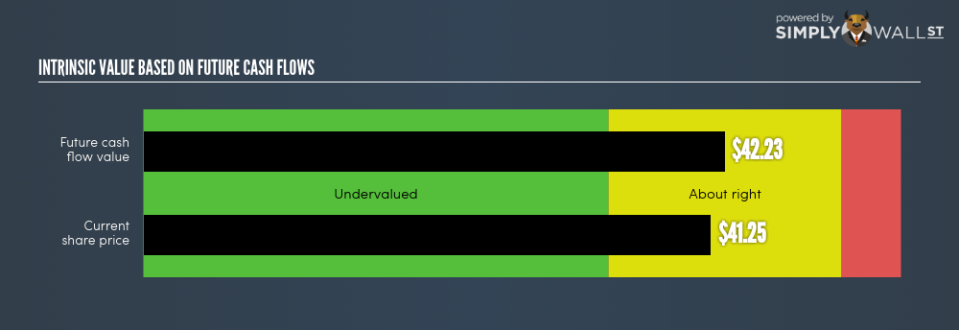
The total value is the sum of cash flows for the next five years and the discounted terminal value, which results in the Total Equity Value, which in this case is US$59.52b. In the final step we divide the equity value by the number of shares outstanding. If the stock is an depositary receipt (represents a specified number of shares in a foreign corporation) or ADR then we use the equivalent number. This results in an intrinsic value of $42.23. Relative to the current share price of $41.25, the stock is about right, perhaps slightly undervalued at a 2.32% discount to what it is available for right now.
Important assumptions
The calculation above is very dependent on two assumptions. The first is the discount rate and the other is the cash flows. If you don’t agree with my result, have a go at the calculation yourself and play with the assumptions. Because we are looking at General Motors as potential shareholders, the cost of equity is used as the discount rate, rather than the cost of capital (or weighed average cost of capital, WACC) which accounts for debt. In this calculation I’ve used 13.7%, which is based on a levered beta of 1.527. This is derived from the Bottom-Up Beta method based on comparable companies, with an imposed limit between 0.8 and 2.0, which is a reasonable range for a stable business.
Next Steps:
Although the valuation of a company is important, it shouldn’t be the only metric you look at when researching a company. For GM, I’ve put together three essential factors you should further examine:
Financial Health: Does GM have a healthy balance sheet? Take a look at our free balance sheet analysis with six simple checks on key factors like leverage and risk.
Future Earnings: How does GM’s growth rate compare to its peers and the wider market? Dig deeper into the analyst consensus number for the upcoming years by interacting with our free analyst growth expectation chart.
Other High Quality Alternatives: Are there other high quality stocks you could be holding instead of GM? Explore our interactive list of high quality stocks to get an idea of what else is out there you may be missing!
PS. Simply Wall St does a DCF calculation for every US stock every 6 hours, so if you want to find the intrinsic value of any other stock just search here.
To help readers see pass the short term volatility of the financial market, we aim to bring you a long-term focused research analysis purely driven by fundamental data. Note that our analysis does not factor in the latest price sensitive company announcements.
The author is an independent contributor and at the time of publication had no position in the stocks mentioned.

