50 Best Places for the Young and Wealthy To Live

Where should rich, young Americans live? The best cities aren’t the traditional ones we associate with prosperity, like New York City or Los Angeles. This demographic is prioritizing residing in safe metros such as Austin and Seattle, where they can earn upwards of $150,000 a year and continue growing their wealth.
Check Out: 10 Best and 10 Worst States for Millennials To Buy a Home
Learn More: 5 Subtly Genius Moves All Wealthy People Make With Their Money
To find the best places for the young and wealthy to live in, GOBankingRates analyzed various key factors from the U.S. Census American Community Survey, Sperling’s BestPlaces, the Bureau of Labor Statistics Consumer Expenditure Survey and the Federal Reserve Economic Data. Each city’s property crime and violent crime statistics per 1,000 residents was sourced from the FBI’s Crime Data Explorer along with the livability index from AreaVibes to determine the overall quality of life. Wealthy, in this study, refers to being in the upper class income range. GOBankingRates used a minimum household income of $150,000 for this study.
Check out 50 top places for young, wealthy people to live.
Key Findings
Cambridge, Massachusetts, ranked as the best city for the young and wealthy to live in. Just over 40% of the population are ages 25 to 44 and 63% of 25-44 households have income of $150,000 or more.
With Cambridge at No. 1, the remaining top 10 cities include Jersey City (New Jersey), Santa Clara (California), Hillsboro (Oregon), Boston, Sandy Springs (Georgia), Rochester (Minnesota), Austin (Texas), Seattle and Sunnyvale (California).
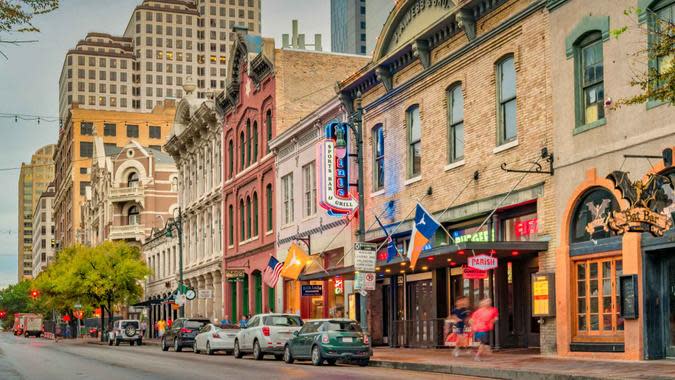
Texas had the most cities out of any state to rank in the top 50. These seven cities include Austin (#8), Richardson (#18), Denton (#19), Dallas (#28), Irving (#34). Odessa (#41) and Lewisville (#46).
No cities in Florida ranked within the top 50.
Keep reading to discover which 50 cities rank among the best for young, wealthy Americans.
Discover More: 20 Best Cities Where You Can Buy a House for Under $100K
Explore More: The Salary Needed To Afford America’s 50 Biggest Cities
Trending Now: Suze Orman's Secret to a Wealthy Retirement--Have You Made This Money Move?

1. Cambridge, Massachusetts
% of population ages 25-44: 40.2%
% of all households with ages 25-44 making $150K+ income: 29.1%
% of 25-44 households with $150K+ income: 63.0%
Livability score: 86
Property crime rate: 23.9
Violent crime rate: 4.8
Find Out: The 30 Safest and Richest US Cities To Live in 2024
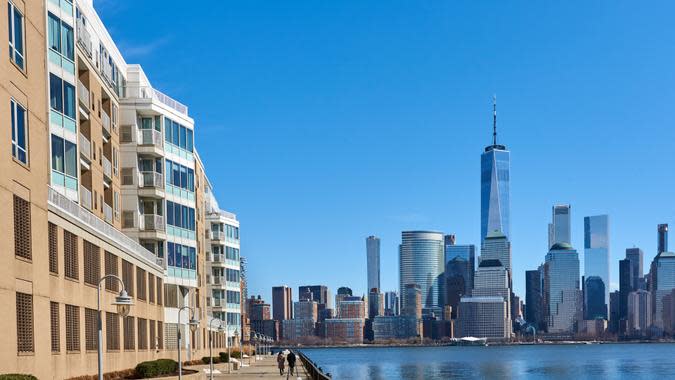
2. Jersey City, New Jersey
% of population ages 25-44: 40.3%
% of all households with ages 25-44 making $150K+ income: 23.6%
% of 25-44 households with $150K+ income: 47.9%
Livability score: 82
Property crime rate: 14.4
Violent crime rate: 2.8

3. Santa Clara, California
% of population ages 25-44: 39.9%
% of all households with ages 25-44 making $150K+ income: 23.8%
% of 25-44 households with $150K+ income: 61.7%
Livability score: 76
Property crime rate: 29.3
Violent crime rate: 2.1
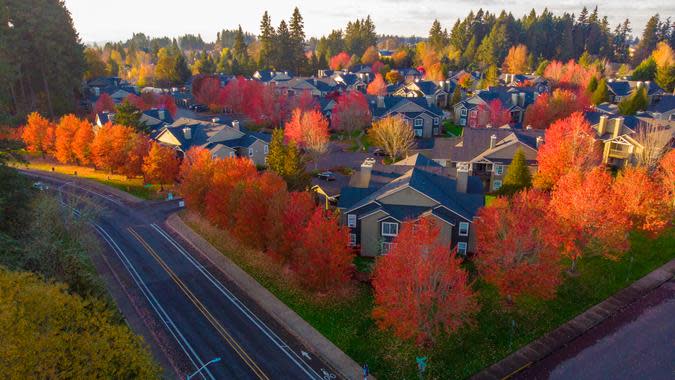
4. Hillsboro, Oregon
% of population ages 25-44: 35.2%
% of all households with ages 25-44 making $150K+ income: 16.5%
% of 25-44 households with $150K+ income: 54.2%
Livability score: 88
Property crime rate: 25.0
Violent crime rate: 2.9
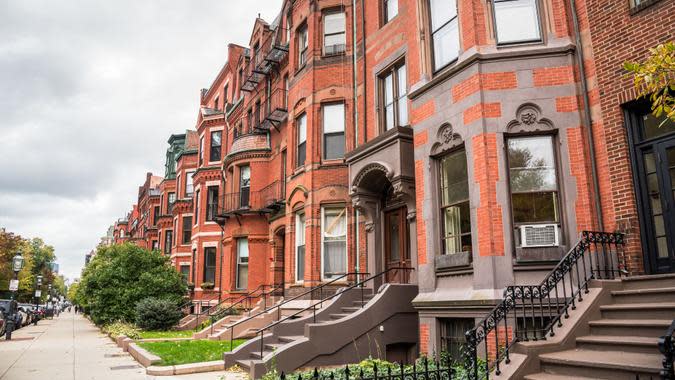
5. Boston
% of population ages 25-44: 36.3%
% of all households with ages 25-44 making $150K+ income: 21.0%
% of 25-44 households with $150K+ income: 55.7%
Livability score: 77
Property crime rate: 19.4
Violent crime rate: 6.3

6. Sandy Springs, Georgia
% of population ages 25-44: 39.0%
% of all households with ages 25-44 making $150K+ income: 22.6%
% of 25-44 households with $150K+ income: 47.5%
Livability score: 73
Property crime rate: 16.9
Violent crime rate: 1.5
Read More: What Is the Median Income for the Upper Middle Class in 2024?

7. Rochester, Minnesota
% of population ages 25-44: 31.8%
% of all households with ages 25-44 making $150K+ income: 10.3%
% of 25-44 households with $150K+ income: 37.0%
Livability score: 92
Property crime rate: 15.9
Violent crime rate: 1.6
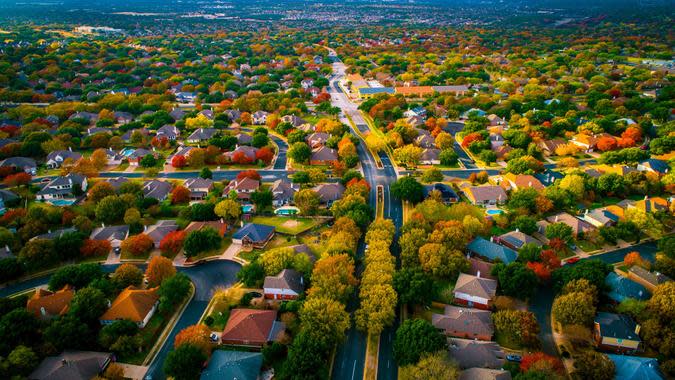
8. Austin, Texas
% of population ages 25-44: 40.4%
% of all households with ages 25-44 making $150K+ income: 20.9%
% of 25-44 households with $150K+ income: 40.3%
Livability score: 83
Property crime rate: 33.1
Violent crime rate: 5.0

9. Seattle
% of population ages 25-44: 41.7%
% of all households with ages 25-44 making $150K+ income: 24.2%
% of 25-44 households with $150K+ income: 58.7%
Livability score: 75
Property crime rate: 50.1
Violent crime rate: 7.8
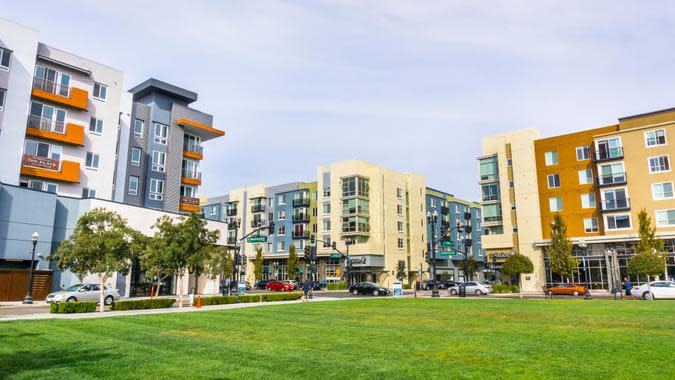
10. Sunnyvale, California
% of population ages 25-44: 38.4%
% of all households with ages 25-44 making $150K+ income: 16.6%
% of 25-44 households with $150K+ income: 36.4%
Livability score: 82
Property crime rate: 19.2
Violent crime rate: 2.5

11. Richmond, Virginia
% of population ages 25-44: 35.5%
% of all households with ages 25-44 making $150K+ income: 17.2%
% of 25-44 households with $150K+ income: 41.7%
Livability score: 84
Property crime rate: 37.2
Violent crime rate: 3.6
Read Next: How Much Money Is Needed To Be Considered Middle Class in Every State?

12. Grand Rapids, Michigan
% of population ages 25-44: 33.6%
% of all households with ages 25-44 making $150K+ income: 17.1%
% of 25-44 households with $150K+ income: 45.2%
Livability score: 83
Property crime rate: 30.4
Violent crime rate: 8.8

13. Quincy, Massachusetts
% of population ages 25-44: 35.7%
% of all households with ages 25-44 making $150K+ income: 15.6%
% of 25-44 households with $150K+ income: 32.7%
Livability score: 81
Property crime rate: 11.1
Violent crime rate: 3.4
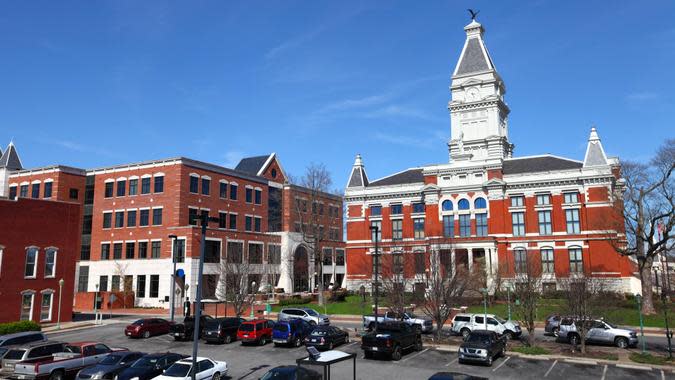
14. Clarksville, Tennessee
% of population ages 25-44: 34.2%
% of all households with ages 25-44 making $150K+ income: 14.3%
% of 25-44 households with $150K+ income: 35.1%
Livability score: 83
Property crime rate: 17.3
Violent crime rate: 4.7
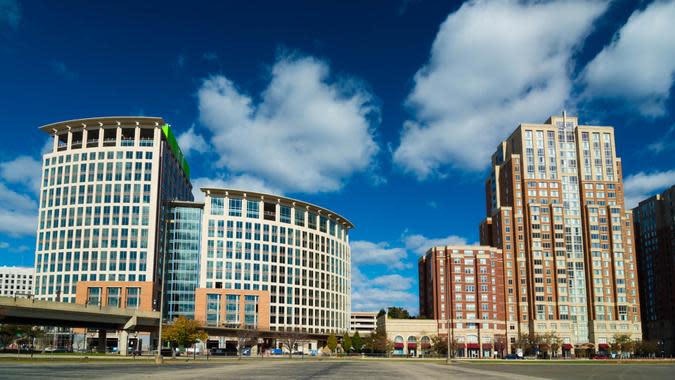
15. Alexandria, Virginia
% of population ages 25-44: 39.2%
% of all households with ages 25-44 making $150K+ income: 12.7%
% of 25-44 households with $150K+ income: 38.5%
Livability score: 83
Property crime rate: 24.3
Violent crime rate: 2.3

16. Bellevue, Washington
% of population ages 25-44: 35.1%
% of all households with ages 25-44 making $150K+ income: 10.6%
% of 25-44 households with $150K+ income: 39.6%
Livability score: 87
Property crime rate: 34.4
Violent crime rate: 1.5
For You: Here’s the Cost of Living in Every State

17. Tempe, Arizona
% of population ages 25-44: 32.3%
% of all households with ages 25-44 making $150K+ income: 18.4%
% of 25-44 households with $150K+ income: 42.1%
Livability score: 78
Property crime rate: 35.7
Violent crime rate: 5.0
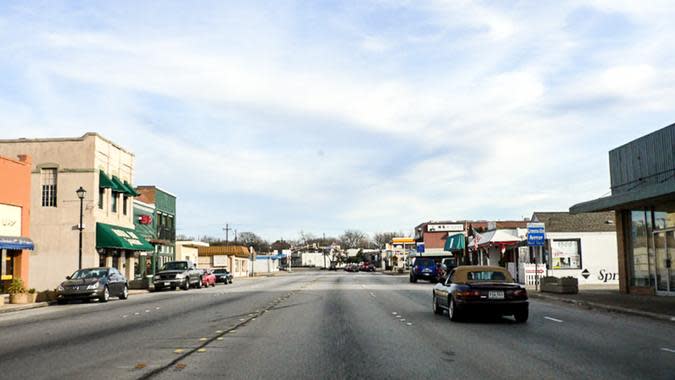
18. Richardson, Texas
% of population ages 25-44: 30.1%
% of all households with ages 25-44 making $150K+ income: 10.5%
% of 25-44 households with $150K+ income: 30.4%
Livability score: 84
Property crime rate: 20.2
Violent crime rate: 1.3

19. Denton, Texas
% of population ages 25-44: 30.4%
% of all households with ages 25-44 making $150K+ income: 11.9%
% of 25-44 households with $150K+ income: 27.9%
Livability score: 85
Property crime rate: 21.9
Violent crime rate: 2.5

20. Providence, Rhode Island
% of population ages 25-44: 31.0%
% of all households with ages 25-44 making $150K+ income: 11.5%
% of 25-44 households with $150K+ income: 31.0%
Livability score: 82
Property crime rate: 19.1
Violent crime rate: 3.1
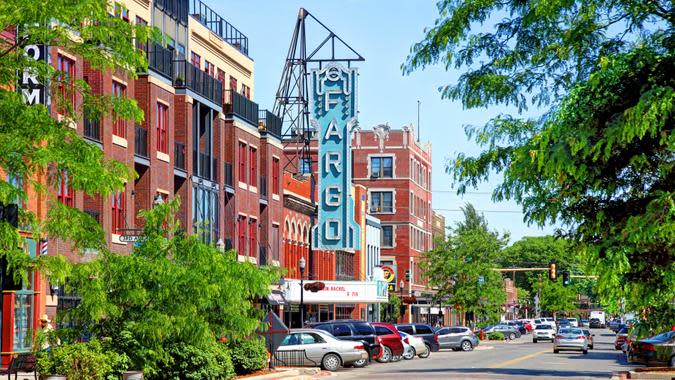
21. Fargo, North Dakota
% of population ages 25-44: 31.0%
% of all households with ages 25-44 making $150K+ income: 12.7%
% of 25-44 households with $150K+ income: 37.7%
Livability score: 84
Property crime rate: 38.8
Violent crime rate: 5.2
Trending Now: Here’s How Much You Need To Earn To Be ‘Rich’ in Every State
22. Madison, Wisconsin
% of population ages 25-44: 32.1%
% of all households with ages 25-44 making $150K+ income: 11.7%
% of 25-44 households with $150K+ income: 29.8%
Livability score: 82
Property crime rate: 23.3
Violent crime rate: 3.0

23. Stamford, Connecticut
% of population ages 25-44: 31.5%
% of all households with ages 25-44 making $150K+ income: 13.5%
% of 25-44 households with $150K+ income: 36.7%
Livability score: 70
Property crime rate: 11.6
Violent crime rate: 1.7

24. Chicago
% of population ages 25-44: 34.5%
% of all households with ages 25-44 making $150K+ income: 13.2%
% of 25-44 households with $150K+ income: 41.7%
Livability score: 78
Property crime rate: 34.3
Violent crime rate: 6.1

25. Spokane Valley, Washington
% of population ages 25-44: 30.5%
% of all households with ages 25-44 making $150K+ income: 10.3%
% of 25-44 households with $150K+ income: 32.0%
Livability score: 85
Property crime rate: 34.3
Violent crime rate: 3.0

26. Columbus, Ohio
% of population ages 25-44: 34.0%
% of all households with ages 25-44 making $150K+ income: 13.5%
% of 25-44 households with $150K+ income: 28.9%
Livability score: 81
Property crime rate: 27.0
Violent crime rate: 3.9
Check Out: 5 Cities Where Homes Will Be a Total Steal in 2 Years
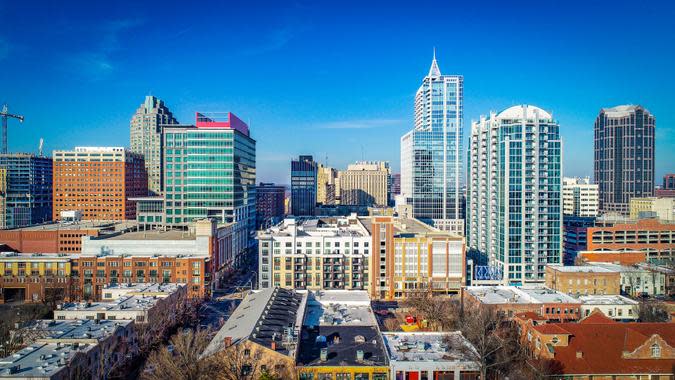
27. Raleigh, North Carolina
% of population ages 25-44: 32.5%
% of all households with ages 25-44 making $150K+ income: 11.6%
% of 25-44 households with $150K+ income: 27.2%
Livability score: 84
Property crime rate: 25.9
Violent crime rate: 5.3

28. Dallas
% of population ages 25-44: 33.3%
% of all households with ages 25-44 making $150K+ income: 13.3%
% of 25-44 households with $150K+ income: 37.5%
Livability score: 81
Property crime rate: 40.3
Violent crime rate: 6.7

29. Fort Collins, Colorado
% of population ages 25-44: 30.9%
% of all households with ages 25-44 making $150K+ income: 11.2%
% of 25-44 households with $150K+ income: 28.1%
Livability score: 81
Property crime rate: 24.4
Violent crime rate: 3.0

30. Atlanta
% of population ages 25-44: 35.9%
% of all households with ages 25-44 making $150K+ income: 15.6%
% of 25-44 households with $150K+ income: 37.4%
Livability score: 78
Property crime rate: 38.9
Violent crime rate: 7.1

31. San Diego
% of population ages 25-44: 33.9%
% of all households with ages 25-44 making $150K+ income: 12.3%
% of 25-44 households with $150K+ income: 31.5%
Livability score: 75
Property crime rate: 18.1
Violent crime rate: 4.2
Learn More: 5 Housing Markets That Will Plummet in Value Before the End of 2025
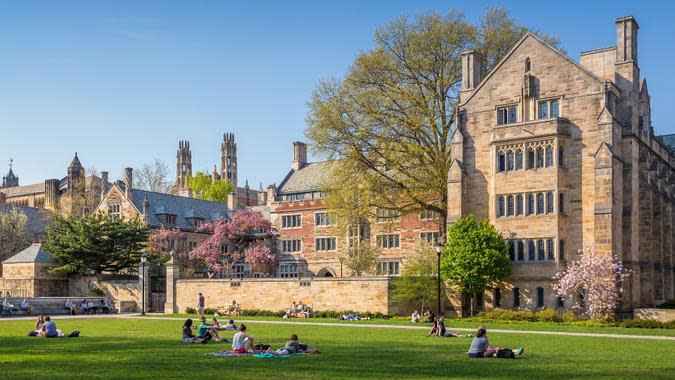
32. New Haven, Connecticut
% of population ages 25-44: 33.3%
% of all households with ages 25-44 making $150K+ income: 12.9%
% of 25-44 households with $150K+ income: 36.6%
Livability score: 78
Property crime rate: 36.9
Violent crime rate: 5.4
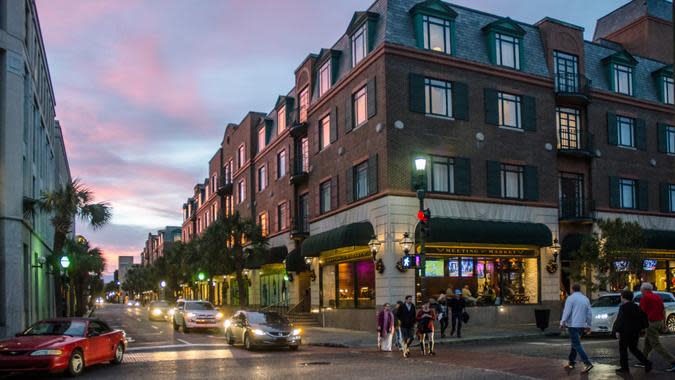
33. Charleston, South Carolina
% of population ages 25-44: 33.1%
% of all households with ages 25-44 making $150K+ income: 12.1%
% of 25-44 households with $150K+ income: 28.7%
Livability score: 77
Property crime rate: 19.8
Violent crime rate: 4.0

34. Irving, Texas
% of population ages 25-44: 33.3%
% of all households with ages 25-44 making $150K+ income: 11.3%
% of 25-44 households with $150K+ income: 29.4%
Livability score: 78
Property crime rate: 24.5
Violent crime rate: 3.0

35. Minneapolis
% of population ages 25-44: 37.2%
% of all households with ages 25-44 making $150K+ income: 17.4%
% of 25-44 households with $150K+ income: 43.5%
Livability score: 78
Property crime rate: 52.5
Violent crime rate: 11.3
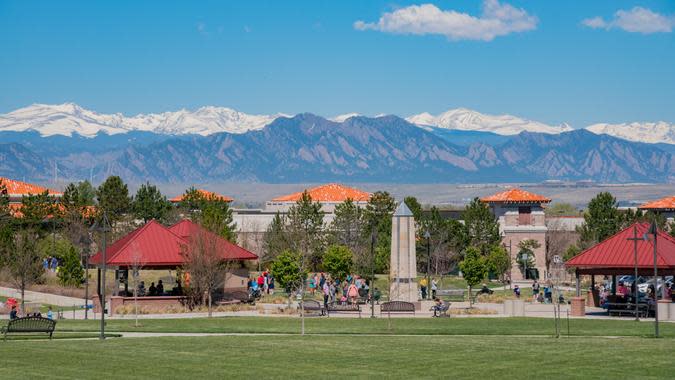
36. Westminster, Colorado
% of population ages 25-44: 33.3%
% of all households with ages 25-44 making $150K+ income: 12.8%
% of 25-44 households with $150K+ income: 40.1%
Livability score: 73
Property crime rate: 36.0
Violent crime rate: 3.3
Discover More: 10 Housing Markets Buyers Are Flocking To as Rates Drop

37. Durham, North Carolina
% of population ages 25-44: 33.8%
% of all households with ages 25-44 making $150K+ income: 12.8%
% of 25-44 households with $150K+ income: 30.6%
Livability score: 82
Property crime rate: 37.6
Violent crime rate: 6.4

38. Denver
% of population ages 25-44: 40.5%
% of all households with ages 25-44 making $150K+ income: 21.4%
% of 25-44 households with $150K+ income: 44.5%
Livability score: 72
Property crime rate: 57.5
Violent crime rate: 10.2
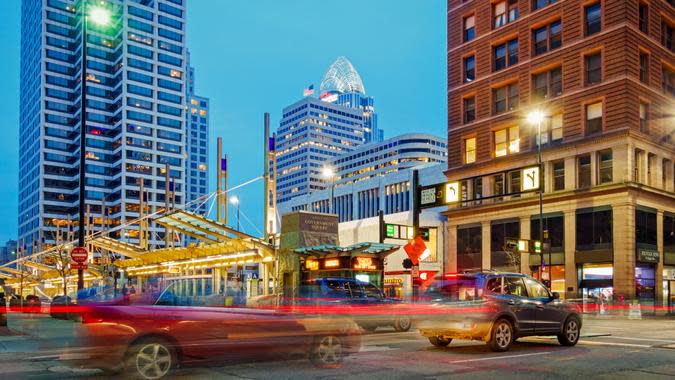
39. Cincinnati
% of population ages 25-44: 32.4%
% of all households with ages 25-44 making $150K+ income: 11.9%
% of 25-44 households with $150K+ income: 37.2%
Livability score: 80
Property crime rate: 42.3
Violent crime rate: 7.3

40. Vancouver, Washington
% of population ages 25-44: 30.0%
% of all households with ages 25-44 making $150K+ income: 10.2%
% of 25-44 households with $150K+ income: 34.5%
Livability score: 82
Property crime rate: 44.9
Violent crime rate: 6.5
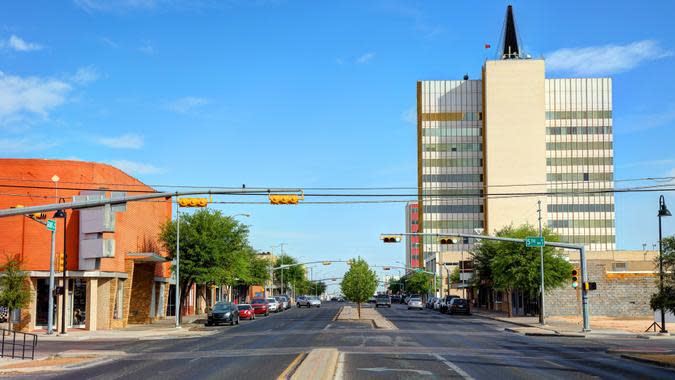
41. Odessa, Texas
% of population ages 25-44: 32.6%
% of all households with ages 25-44 making $150K+ income: 10.3%
% of 25-44 households with $150K+ income: 28.0%
Livability score: 74
Property crime rate: 17.8
Violent crime rate: 3.9
Explore More: 3 Best States to Buy Property in the Next 5 Years, According to Experts

42. Norfolk, Virginia
% of population ages 25-44: 32.0%
% of all households with ages 25-44 making $150K+ income: 11.8%
% of 25-44 households with $150K+ income: 25.3%
Livability score: 81
Property crime rate: 38.2
Violent crime rate: 5.4

43. Rochester, New York
% of population ages 25-44: 32.0%
% of all households with ages 25-44 making $150K+ income: 13.8%
% of 25-44 households with $150K+ income: 38.4%
Livability score: 76
Property crime rate: 50.5
Violent crime rate: 7.3

44. Reno, Nevada
% of population ages 25-44: 30.2%
% of all households with ages 25-44 making $150K+ income: 8.2%
% of 25-44 households with $150K+ income: 27.0%
Livability score: 81
Property crime rate: 26.4
Violent crime rate: 6.0

45. Salt Lake City, Utah
% of population ages 25-44: 34.2%
% of all households with ages 25-44 making $150K+ income: 16.3%
% of 25-44 households with $150K+ income: 40.1%
Livability score: 75
Property crime rate: 56.5
Violent crime rate: 8.7

46. Lewisville, Texas
% of population ages 25-44: 34.0%
% of all households with ages 25-44 making $150K+ income: 11.8%
% of 25-44 households with $150K+ income: 32.9%
Livability score: 66
Property crime rate: 18.1
Violent crime rate: 2.3
Find Out: 3 Best Florida Cities To Buy Property in the Next 5 Years, According To Real Estate Agents

47. Renton, Washington
% of population ages 25-44: 34.1%
% of all households with ages 25-44 making $150K+ income: 10.6%
% of 25-44 households with $150K+ income: 24.8%
Livability score: 82
Property crime rate: 44.3
Violent crime rate: 4.1

48. Sacramento, California
% of population ages 25-44: 33.2%
% of all households with ages 25-44 making $150K+ income: 9.5%
% of 25-44 households with $150K+ income: 38.1%
Livability score: 73
Property crime rate: 28.9
Violent crime rate: 8.0

49. Des Moines, Iowa
% of population ages 25-44: 31.7%
% of all households with ages 25-44 making $150K+ income: 9.7%
% of 25-44 households with $150K+ income: 22.0%
Livability score: 83
Property crime rate: 33.5
Violent crime rate: 7.1

50. San Mateo, California
% of population ages 25-44: 31.2%
% of all households with ages 25-44 making $150K+ income: 7.4%
% of 25-44 households with $150K+ income: 20.6%
Livability score: 79
Property crime rate: 19.2
Violent crime rate: 3.5
Methodology: For this study, GOBankingRates analyzed cities across the United States to find the best places to live for the young and wealthy. First, GOBankingRates found the cities with the largest population of younger people by using the U.S. Census American Community Survey to find the cities with the largest population percentage of the ages 25 to 44. All the cities with a population percentage of at least 30% were kept for this study. For each location, GOBankingRates found total population, population ages 65 and over, total households, and household median income, all sourced from the American Community Survey. Using this data, the percentage of the population ages 65 and over was calculated. The cost-of-living indexes were sourced from Sperling’s BestPlaces and include the grocery, healthcare, housing, utilities, transportation and miscellaneous cost-of-living indexes. Using the indexes and the national average expenditure costs for people ages 25 to 44, as sourced from the Bureau of Labor Statistics Consumer Expenditure Survey, the average expenditure cost for each location was calculated. The livability index was sourced from AreaVibes for each location and included to determine the overall quality of life. The average single-family home value was sourced from Zillow Home Value Index for October 2024. Using the average home value, assuming a 10% down payment, and using the most recent national average 30-year fixed mortgage rate, as sourced from the Federal Reserve Economic Data, the average mortgage was calculated. Using the average mortgage and average expenditure costs, the average cost of living was calculated. The property crime and violent crime statistics were sourced from the FBI’s Crime Data Explorer. For this study, “wealthy” refers to being in the upper class income range, setting the minimum household income for the upper income range as $154,000. GOBankingRates used $150,000 for this study. The number of households where the householder is 25 to 44 and the household income is above $150,000 was recorded from the American Community Survey; using this data, the percentage of households where the householder is 25 to 44 and earning over $150,000 was calculated. The livability index was scored and weighted at 2.00, the percentage of households where the householder is 25 to 44 and earning over $150,000 when compared to other householders of the same status was scored and weighted at 2.00, the percentage of households where the householder is 25 to 44 and earning over $150,000 when compared to all other householders was scored and weighted at 2.00, the property crime rate was scored and weighted at 1.50, and the violent crime rate was scored and weighted at 1.50. All the scores were summed and sorted to show the best places to live for young and wealthy residents. All data was collected on and is up to date as of Dec. 4, 2024.
More From GOBankingRates
3 Things Retirees Should Sell To Build Their Retirement Savings
The Trump Economy Begins: 4 Money Moves Retirees Should Make Before Inauguration Day
9 Moves For Building Lasting Wealth: What Smart Americans Are Doing Right
5 Side Hustles That Can Earn You an Extra $1,000 Before 2025
This article originally appeared on GOBankingRates.com: 50 Best Places for the Young and Wealthy To Live


