
Can we trust the role of copper in the market?

Can copper be trusted? Not with your life, of course, but your money. More importantly, the context of the discussion we've been having about reliable price signals, is 'Dr Copper' giving a healthy prognosis for the economy and the stock market.
If you're not familiar with copper's moniker as 'Dr Copper', allow me to explain (and if you are, skip ahead to the chart). Market watchers traditionally use the copper price as a leading indicator for the economy. A lot of copper is used in plumbing and for electricity generation and wiring. If construction (residential and commercial) and manufacturing are in expansion, then copper use goes up.
In the great chain of economic activity, copper is near the beginning. Before you ever see a pick-up in final demand (consumer spending), you'll see a pick-up in raw materials prices. The copper goes to the factory. The factory makes the widget. The widget goes on a ship. The ship goes to your country. The widget gets put on a lorry, which goes to a store, where you find it on a shelf, buy it, take it home and put it on your shelf with all your other widgets. It all begins with copper.
Healthy copper, healthy economy. Sick copper, sick economy.
Now look at the chart.
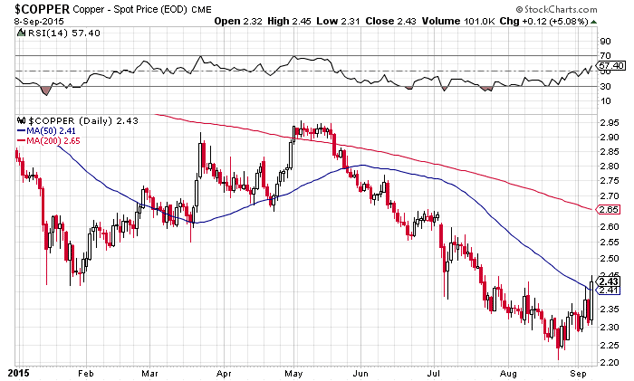
Copper price chart
It's a short-term chart so it's only going to tell you about short-term moves. But what does it tell you? Yesterday's action took the spot price above the 50-day moving average (the blue line). That's somewhat bullish. A lot more bullish would be the 50-day moving average crossing the 200-day moving average (the red line). Also note that for first time since June, the relative strength index (RSI) is above 50.
For the RSI to get and stay above 50, something has to happen in the outside world. That 'something' is usually an increase in demand. I say usually because copper, like many commodities (and really like all assets in a low interest rate world) has become 'financialised.' What do I mean by that?
If a price were always just a function of supply and demand then you could trust it to be accurate. But in a low interest rate world with cheap credit, there is a lot of 'financial' demand for commodities (at least there was before the bubble burst). This 'financial' demand is different from real demand.
For example, in China, copper (like iron ore) is sometimes used as collateral to secure loans. This happens in the 'shadow banking system'. Traders and speculators accumulate real assets to use as security for loans from non-bank lenders. I know, I know. It's crazy. But this is why China is such a dangerous beast right now. No one really knows the extent of the debt shenanigans.
But back to copper. If the price movement is due to financial demand, then the price signal is bogus, or at least not a leading indicator of economic expansion.
Dr Copper isn't lying. He's just not telling the truth about the economy.
If, on the other hand, the price move is related to, say, China's State Council announcing plans for another big stonking stimulus package, then copper is telling us that stock prices might head higher soon. But you don't have to take my word for that. Check out Antofagasta's share price below.
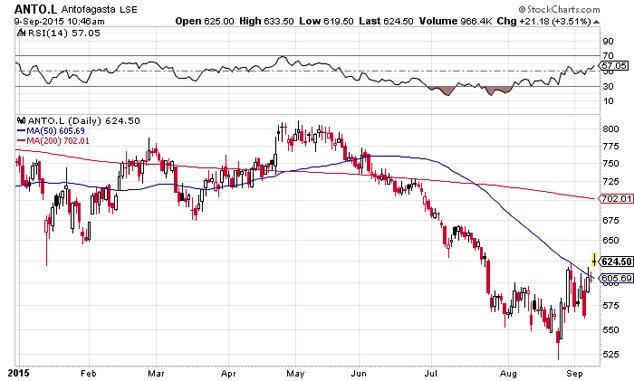
Antofagasta share price chart
Antofagasta is a Chilean copper miner listed here in London. You can see its chart is similar to the spot copper price. It's crossed the 50-day moving average. The RSI is above 50.
This is the kind of 'signals intelligence' Tim Price always talks about. Technical indicators and trustworthy market data can help you make a better investment decisions. But the signals are only one component of making that decision. You have to talk to other people who know things (human intelligence) and you have to use your own experience at seeing things (pattern recognition).
Beyond the analysis, it also comes down to judgement. That, by the way, is what you're really paying for when you get a good financial adviser. Some people have better data. But that's not really a competitive advantage these days. Some people have better execution (the algorithms and high-frequency traders), but you can't compete with them, and it requires huge amounts of borrowed money to leverage up micro gains.
You can't buy judgement and experience, though. And in that context, the copper chart tells you only part of the story. The rest of the story is that China will spend more money on infrastructure and lower tax rates, according to an announcement yesterday from the Chinese Ministry of Finance. In GDP terms, you have a dash of fixed-asset investment (infrastructure) and a spice of consumer spending (lower taxes).
The copper price is reacting to the infrastructure spending. The chief central planning body in China is the National Development and Reform Commission (NDRC). The NDRC approved £7.1bn in new railway projects yesterday. This is the China we all know and love, a command economy that engineers 20 years of roaring GDP growth through massive investment.
But is that enough to turn things around? August exports fell by 5.5%, according to the NDRC. But it says other indicators – like average daily rail freight traffic – show that the economy is 'stablising'. And yesterday, MoneyWeek editor Merryn Somerset Webb sent me a link to a story about China's massively ambitious 'One Belt, One Road' project. Ever heard of it?
Let me fill you in. China wants to rebuild the Silk Road. From Indonesia to Hungary, it wants to link up the entire Eurasian landmass into a new powerhouse economic zone. This is the logical next frontier if you're fixated on fixed-asset investment as the path to growth.
China already has way too much manufacturing capacity. It's been exporting 'deflation' this way, via cheaper goods. But the $2.5trn plan to physically link up unconnected parts of the world? That's a different beast altogether. And it's already happening
Chinese manufacturer XCMG – a machine maker – opened a factory in Uzbekistan this month employing 300 people. Hanson Liu, the assistant president of the company, explained:
"This is China's grand strategy. It's like how a person in a village has gotten rich and wants to fix roads, build power points, street lamps for the neighbourhood. Our company, from top to bottom, is focused on this."
XCMG is a state-owned enterprise (SEO). Its strategy is China's strategy. And China's strategy is to boost export growth and literally build the sinews of commerce throughout Eurasia.
Say what you will about the follies of central planning – and they are many – but if you're going to go, you might as well go big. And China can't go much bigger than the 'One Belt, One Road' project. But will it work?
That's a question for the long term. In the short term, the copper price is moving. Stocks – being the forward looking beasties they're supposed to be – are also a leading indicator. If the market turns here, will it be the sign of a new China-induced bull market? Or will it be more false hopes based on fiscal policy (stimulus) and monetary policy? And how long will the optimism last?
It could last for a few days. Not to be outdone by China, Japan's economics minister told reporters yesterday that his government would spend £54bn this fall to boost growth. Akira Amari didn't elaborate on what kind of spending, but it probably won't be more bridges and roads.
Japan has been concreting over its lovely countryside with hideous bridges and roads for the last 20 years. That's why it has a public-debt-to-GDP ratio of 230%. It has averted a larger collapse through endless spending on useless projects.
It hasn't helped stock, by the way. The Nikkei was up 7.7% on Wednesday and closed at 18,770. That's still 20,000-odd points and 50% down from its all-time high of 38,916. That, by the way, was on 29 December, 1989 – 26 years ago.
I suppose, though, that's the best-case scenario for UK investors if Tim Price is right about the problems here and in the global financial system. A slow-motion depression draws a debt deflation out over a long period of time. Japan had lots of savings to soak up its explosion in public-sector debt.
Savers, scared off by the stockmarket and the property crash, were happy to park pension money in government bonds. If it didn't go up, at least it didn't disappear. Thus the long hangover from a credit boom.
The UK may not be so lucky. Public sector debt as a percentage of GDP is at an all-time high of 89.4%. That's not Japan levels, of course. Monetarists will even argue for more fiscal stimulus and a higher debt-to-GDP ratio. In fact, in the next crisis/slump that's probably exactly what will happen.
But while Japan has a positive trade balance, Britain does not. It has the current account deficit (as a percentage of GDP) of an emerging market country. That means when the next crisis hits and capital flees, British interest rates could spike, bond prices will fall, stocks will be no safe haven, and the authorities will have to react.
And react they most certainly will.
This article is taken from the free daily email Capital & Conflict.
More on AOL Money:
FTSE 100 Crash? Buy, Buy, Buy!
Sick of the stock market? How about classic cars or coins?
The rout in junk bonds could spread fast


