
Coronavirus pandemic shifts London property hotspots on tube lines
Properties further out on London commuter lines are seeing the biggest jump in the number of buyers looking for a new home, a complete reversal compared with this time last year, new analysis by property website Rightmove has found.
The majority of zones have swapped demand rankings compared with the previous year, and the rise in the number of buyers now increases as zones move further out from the centre of the capital.
Estate agents have said buyers are looking to move to areas with more living and green space in the wake of the coronavirus pandemic, resulting lockdowns and increased remote working opportunities.
The number of buyers in zone 6 has gone up by 108% this year, after having 9% more buyers in September 2019 compared with the previous year.
Watch: What is shared ownership?
READ MORE: Nearly half of UK homeowners see property price rise overtake cost of yearly upkeep
Zone 5 saw an increase of 103% between 2019 and 2020, compared with an 8% rise the year before.
At the other end of the scale, zone 1 has moved from being 41% up year-on-year in 2019, to now being just 7% up.
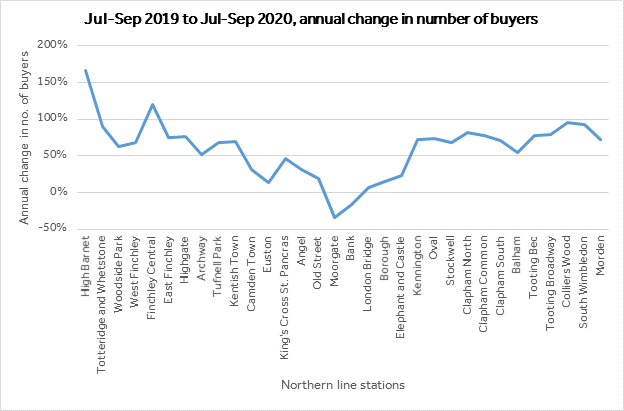
Analysis along the Northern line shows the biggest jump in demand is at the end of the line, with High Barnet attracting the highest number of buyers — up 166%. Finchley Central comes in second place, up 120%.
Central locations Moorgate and Bank are bottom of the list, down 34% and 16% respectively.
Northern locations of the northern line are performing more strongly than the southern locations, and there is a clear dip in demand along the zone 1 stations, according to Rightmove.
Zone 1 is the only zone that has seen house prices fall in the last year. The average asking price for a home in zone 1 in October 2020 was £1,245,254 ($1,630,970), a drop of 8.2% from the year before.
Zone 4 has seen the greatest rise in average asking prices over the past year, up 5.2% to £502,013.
The lowest prices can be found in zone 5, with an average asking price of £494,013 in October 2020, a rise of 4% from £474,928 a year before.
Rightmove’s head of property data Tim Bannister said: “Agents have been reporting a number of people selling up in the inner London zones and moving further out, but to see this reversal in the demand trend reflected so clearly in the data is quite something.
READ MORE: Coronavirus: More than two-thirds of UK homeowners have decided not to move
“Some buyers still expecting to commute into the centre in the long term may have now adjusted their mindset about how many zones they’re prepared to move out, leading to zone 6 being the new favourite.
“This data demonstrates the short term trend of more central places like Moorgate and Bank seeing lower demand right now — although it’s worth noting that it’s off strong demand levels for these locations a year ago. I do think this demand will come back eventually but it’s not clear yet how long it will take.”
WATCH: Why are house prices rising?

