
Coda Octopus Group, Inc.'s (NASDAQ:CODA) Financials Are Too Obscure To Link With Current Share Price Momentum: What's In Store For the Stock?
Most readers would already be aware that Coda Octopus Group's (NASDAQ:CODA) stock increased significantly by 36% over the past three months. However, we decided to pay attention to the company's fundamentals which don't appear to give a clear sign about the company's financial health. Particularly, we will be paying attention to Coda Octopus Group's ROE today.
Return on Equity or ROE is a test of how effectively a company is growing its value and managing investors’ money. Put another way, it reveals the company's success at turning shareholder investments into profits.
View our latest analysis for Coda Octopus Group
How Do You Calculate Return On Equity?
The formula for ROE is:
Return on Equity = Net Profit (from continuing operations) ÷ Shareholders' Equity
So, based on the above formula, the ROE for Coda Octopus Group is:
8.6% = US$3.7m ÷ US$43m (Based on the trailing twelve months to July 2022).
The 'return' is the profit over the last twelve months. So, this means that for every $1 of its shareholder's investments, the company generates a profit of $0.09.
What Is The Relationship Between ROE And Earnings Growth?
We have already established that ROE serves as an efficient profit-generating gauge for a company's future earnings. We now need to evaluate how much profit the company reinvests or "retains" for future growth which then gives us an idea about the growth potential of the company. Assuming everything else remains unchanged, the higher the ROE and profit retention, the higher the growth rate of a company compared to companies that don't necessarily bear these characteristics.
Coda Octopus Group's Earnings Growth And 8.6% ROE
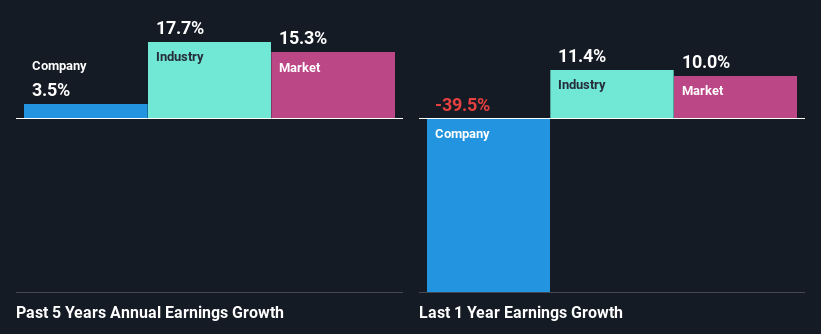
On the face of it, Coda Octopus Group's ROE is not much to talk about. A quick further study shows that the company's ROE doesn't compare favorably to the industry average of 14% either. As a result, Coda Octopus Group reported a very low income growth of 3.5% over the past five years.
We then compared Coda Octopus Group's net income growth with the industry and found that the company's growth figure is lower than the average industry growth rate of 18% in the same period, which is a bit concerning.
The basis for attaching value to a company is, to a great extent, tied to its earnings growth. What investors need to determine next is if the expected earnings growth, or the lack of it, is already built into the share price. This then helps them determine if the stock is placed for a bright or bleak future. One good indicator of expected earnings growth is the P/E ratio which determines the price the market is willing to pay for a stock based on its earnings prospects. So, you may want to check if Coda Octopus Group is trading on a high P/E or a low P/E, relative to its industry.
Is Coda Octopus Group Making Efficient Use Of Its Profits?
Coda Octopus Group doesn't pay any dividend, which means that it is retaining all of its earnings. However, this doesn't explain the low earnings growth the company has seen. So there could be some other explanation in that regard. For instance, the company's business may be deteriorating.
Conclusion
On the whole, we feel that the performance shown by Coda Octopus Group can be open to many interpretations. While the company does have a high rate of reinvestment, the low ROE means that all that reinvestment is not reaping any benefit to its investors, and moreover, its having a negative impact on the earnings growth. That being so, the latest analyst forecasts show that the company will continue to see an expansion in its earnings. Are these analysts expectations based on the broad expectations for the industry, or on the company's fundamentals? Click here to be taken to our analyst's forecasts page for the company.
Have feedback on this article? Concerned about the content? Get in touch with us directly. Alternatively, email editorial-team (at) simplywallst.com.
This article by Simply Wall St is general in nature. We provide commentary based on historical data and analyst forecasts only using an unbiased methodology and our articles are not intended to be financial advice. It does not constitute a recommendation to buy or sell any stock, and does not take account of your objectives, or your financial situation. We aim to bring you long-term focused analysis driven by fundamental data. Note that our analysis may not factor in the latest price-sensitive company announcements or qualitative material. Simply Wall St has no position in any stocks mentioned.
Join A Paid User Research Session
You’ll receive a US$30 Amazon Gift card for 1 hour of your time while helping us build better investing tools for the individual investors like yourself. Sign up here

