
Best Value Stocks to Buy for July 20th
Here are three stocks with buy rank and strong value characteristics for investors to consider today, July 20th:
Repsol REPYY: This company which develops and produces crude oil products and natural gas, transports petroleum products and liquified petroleum gas and refines petroleum, carries a Zacks Rank #1(Strong Buy), and has witnessed the Zacks Consensus Estimate for its current year earnings increasing 9.1% over the last 60 days.
Repsol SA Price and Consensus
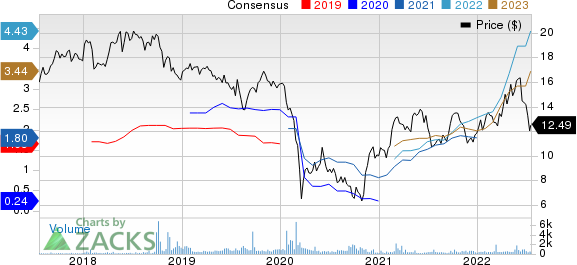
Repsol SA price-consensus-chart | Repsol SA Quote
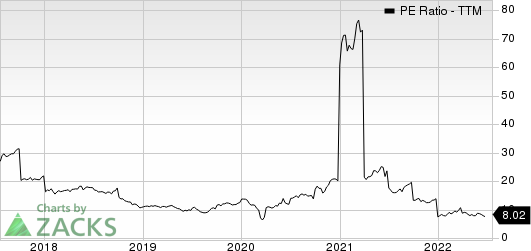
Repsol has a price-to-earnings ratio (P/E) of 2.82 compared with 6.40 for the industry. The company possesses a Value Score of A.
Repsol SA PE Ratio (TTM)

Repsol SA pe-ratio-ttm | Repsol SA Quote
Equinor EQNR: This company which is one of the premier integrated energy companies in the world, with operations spreading across 30 countries, carries a Zacks Rank #1 and has witnessed the Zacks Consensus Estimate for its current-year earnings increasing 11.6% over the last 60 days.
Equinor ASA Price and Consensus
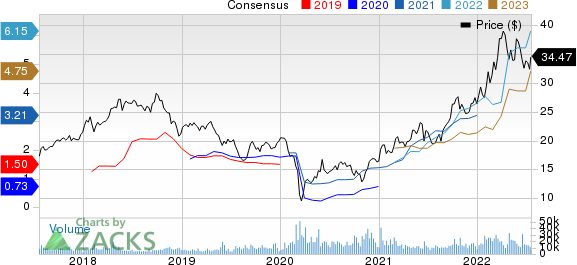
Equinor ASA price-consensus-chart | Equinor ASA Quote
Equinor has a price-to-earnings ratio (P/E) of 5.61, compared with 8.10 for the industry. The company possesses a Value Score of A.
Equinor ASA PE Ratio (TTM)
Equinor ASA pe-ratio-ttm | Equinor ASA Quote
Gildan Activewear GIL: This company which is a manufacturer and marketer of premium quality branded basic activewear for sale principally into the wholesale imprinted activewear segment of the North American apparel market, carries a Zacks Rank #1, and has witnessed the Zacks Consensus Estimate for its current year earnings increasing 3.0% over the last 60 days.
Gildan Activewear, Inc. Price and Consensus
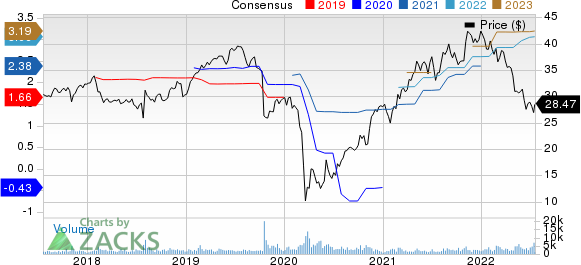
Gildan Activewear, Inc. price-consensus-chart | Gildan Activewear, Inc. Quote
Gildan Activewear has a price-to-earnings ratio (P/E) of 9.30, compared with 12.90 for the industry. The company possesses a Value Score of B.
Gildan Activewear, Inc. PE Ratio (TTM)
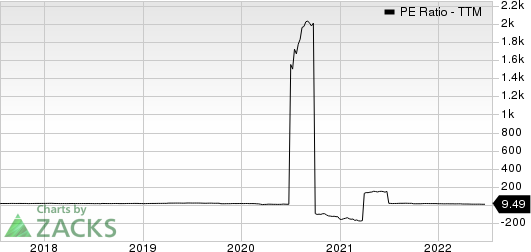
Gildan Activewear, Inc. pe-ratio-ttm | Gildan Activewear, Inc. Quote
See the full list of top ranked stocks here.
Learn more about the Value score and how it is calculated here.
Want the latest recommendations from Zacks Investment Research? Today, you can download 7 Best Stocks for the Next 30 Days. Click to get this free report
Gildan Activewear, Inc. (GIL) : Free Stock Analysis Report
Repsol SA (REPYY) : Free Stock Analysis Report
Equinor ASA (EQNR) : Free Stock Analysis Report
To read this article on Zacks.com click here.
Zacks Investment Research
